Cash on Cash Return… one of the most popular - but WORST - real estate metrics you can be using.
Focus on the right real estate metrics and you can increase your portfolio value by tens of thousands each year.

Why?
They’re focused on the wrong metrics!
With any type of investing — real estate, stocks, savings accounts, etc — in order to know how well your investment is actually doing you need to be tracking some sort of return on investment (ROI) metric. Usually, this is some percentage telling you how well your investment did for that year.
For example, if you invested $100,000 and made $5,000 that year then you made a 5% return and now have a total of $105,000. 5% isn’t a bad return. As a comparison, you probably get less than 1% in your bank account.
Another example: the S&P 500. That has yielded a 10–11% yearly return historically, even when accounting for all the crashes.
Bottom line, you invest an amount. A period of time goes by. You have a different amount. From there you can calculate your return on the initial investment.
But with real estate, it gets a little trickier.
Why?
There are a lot of different investment tracking metrics you can use, and frankly, some of them can be very misleading.
A few types:
- Return on Equity
- Cash on Cash Return
- Cap Rate
- IRR
Previously, we published an article on our favorite metric, Return on Equity, or ROE. I highly recommend reading that prior to reading this article.
Today, we’re going to discuss Cash on Cash Return, one of the most popular — but misleading — metrics out there. In later articles we’ll discuss Cap Rate, IRR, and how to use all four of these together to maximize your returns!
Cash on Cash Return and Return on Equity work differently.
Unlike Return on Equity where you are looking at how well your property’s equity is performing for you, Cash on Cash Return (CoC) is the return from the actual cash you have invested into the property.
In other words, ROE is comparing your earnings or profit against how much of the property value you own — the equity — which might have simply come from growth in the market and not from any actual cash investment on your part… while CoC is only comparing against cash investments you have actually made.
“But wait, isn’t that better then? Shouldn’t the best metric actually be looking at the return of the actual investment I made? Cash on Cash does that, ROE doesn’t…”
True, but CoC is extremely misleading and can actually cause your portfolio ROI to plummet!
Let’s look at the formula for CoC to understand why.
Here is the most common way to calculate CoC. This assumes we are calculating CoC for a single year period.
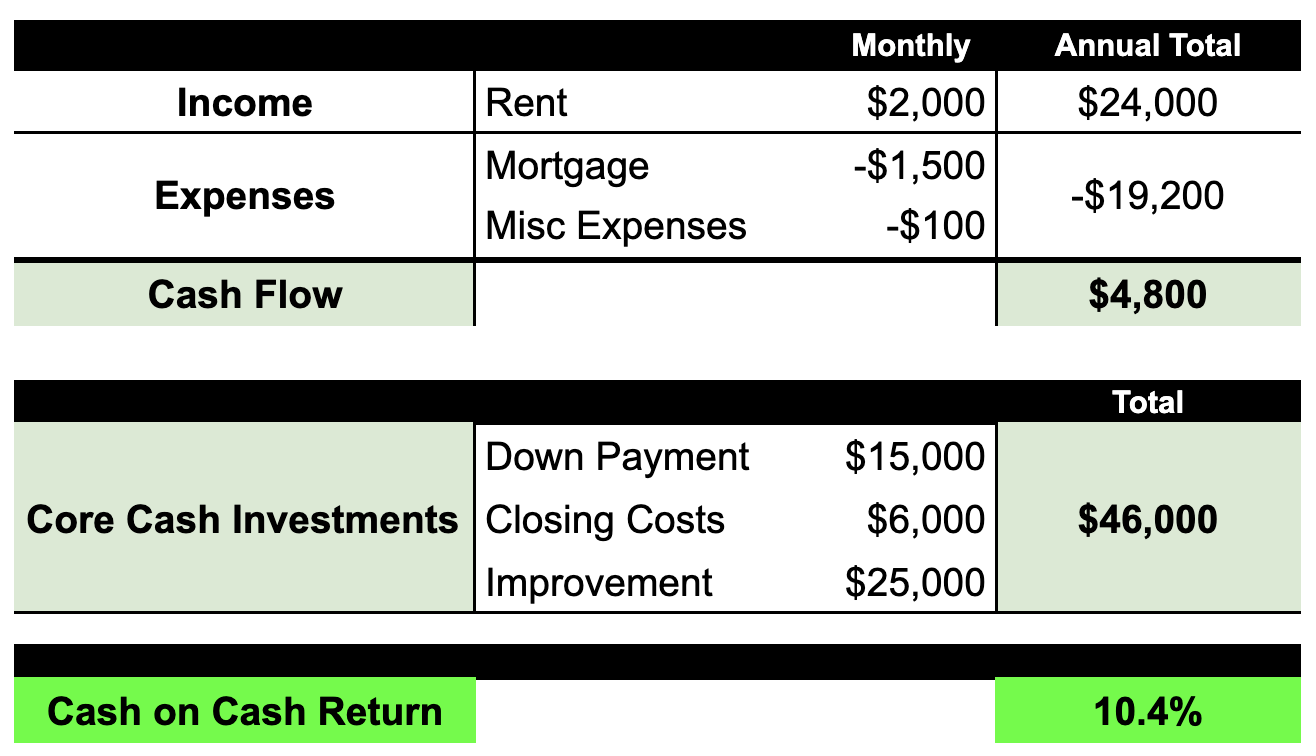
Cash on Cash Return = Cash Flow / Core Cash Investments
First, Cash Flow.
(Quick note, some people use NOI instead of Cash Flow -- just be consistent with whatever you choose).
This is all the cash you net during the year. So it’s all your income (rent, Airbnb, charging the in-laws to crash in one of your properties for the weekend) minus all your recurring expenses (mortgage payments, insurance, HOA, lawn care, utilities, etc).
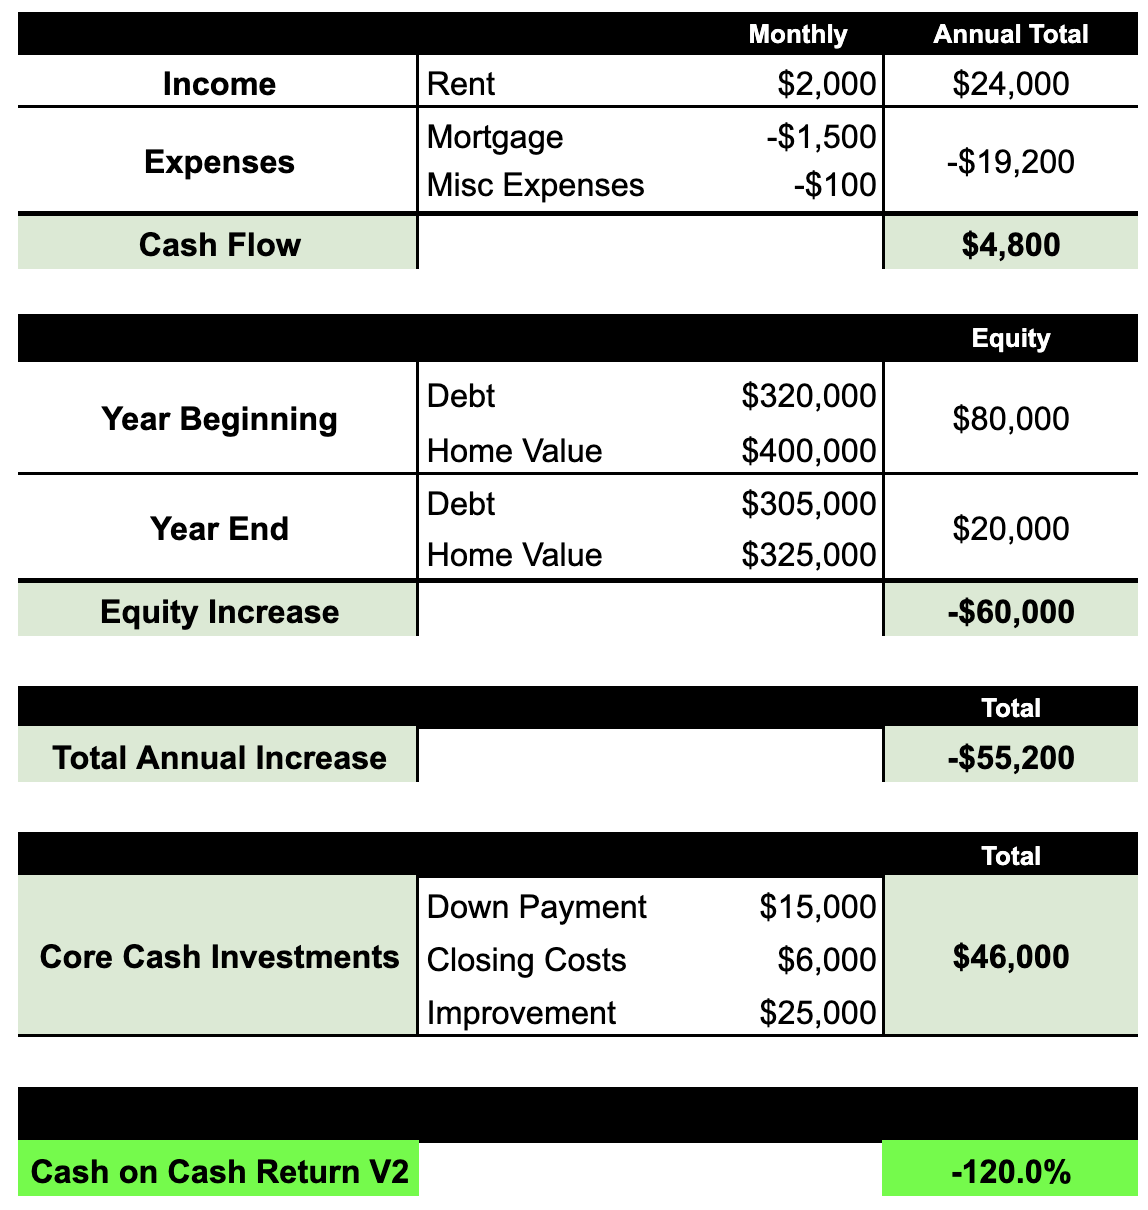
So, let’s say you charge $2,000/m for rent or $24,000 annually. Let’s assume you have a mortgage of $1,500 plus $100/m average for misc expenses that don’t get passed on to the renter. So your expenses are $19,200. Your cash flow is $4,800 annually.
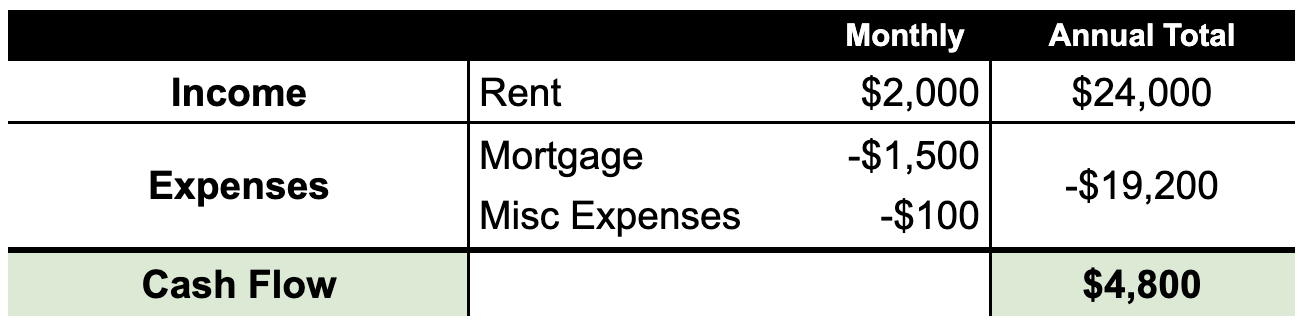
These are all your major expenses that don’t already get covered in your cash flow… things you had to front a chunk of cash for. Things like your initial down payment and closing costs. Maybe a big renovation project you did at some point. Honestly, there is some flexibility between what you put here versus what you put in cash flow. I tend to put anything that could possibly recur year after year in Cash Flow and misc things that pop up (like, I need a new roof) in Core Cash Investments.
So, let’s say you did a down payment of $15,000 with $6,000 in closing costs. You also did a $25,000 improvement project to prep the house. Your Core Cash Investments is $46,000.
Cash Flow is $4,800. Core Cash Investments is $46,000.
So, your CoC return for the year is 10.4%.
Assuming your rent stays the same, your expenses stay relatively even, and you don’t have any major projects, your CoC is going to stay roughly the same over time. This is one reason people like this metric — it’s easy to calculate and quite stable. But this is the reason I hate this metric.
In the above example, let’s say the property was worth $350,000 at the start of the year, but by the end of the year it’s worth $400,000. If I sell the property, I get that extra $50,000.
What if during the next year, the property goes from $400,000 down to $325,000. I’m now down $25,000 from where I originally started ($350,000) and $75,000 from where I was at the beginning of the year ($400,000).
CoC doesn’t help me see this at all! During that entire period, assuming I have a lease with a locked in rental rate, my CoC return is still sitting at 10.4%. It’s not telling me that I’m losing thousands of dollars every month by holding onto my property. This is where ROE surpasses CoC.
However, I’ve corrupted the CoC formula to be able to get some visibility into this. Note, we are now taking a step away from a true CoC formula.
Adjusted CoC (or CoCV2) = Total Annual Increase / Core Cash Investments.
Core Cash Investments is the same as above. Total Annual Increase is what has changed. If you’ve read our post on ROE, this will look familiar.
Total Annual Increase is the combination of your annual cash flow (what we calculated above) plus the equity you have gained (or lost) during the year. You get that by calculating your year-end equity minus your year-beginning equity.
So, building on the above example. You had a Cash Flow of $4,800, but now we have to identify the rest of your annual increase. We need to look at equity.
We previously said that the home value went from $350K to $400K. So, a $50K value increase, right? WRONG.
You also paid down debt throughout the year, which is why you have to look at equity. In the beginning of the year you had $335K in debt. This comes from the $350K sale price minus your $15K down payment. This gave you a starting equity of $15K.
By the end of the year, your debt is roughly down another $15,000 due to the principal portion of your mortgage payment, so it’s at $320,000. The home value is now at $400,000 as mentioned above. This is simply because of market forces (congrats on living in an awesome market). Now you have $80,000 in equity. So your equity increase during the year was $65,000 ($80K minus $15K).
Your cash flow of $4,800 plus equity increase of $65,000 gives you a Total Annual Increase of $69,800.
Divide this by your Core Cash Investment of $46,000 and now your Adjusted CoC is 151.7%. That’s more like it!
That gives you an Adjusted CoC return for year two of -120.0%. The original CoC formula would tell you you had a return of 10.4%.
10.4% versus -120.0%. I personally would want to know that difference…
However, Adjusted CoC is still far from perfect.
It still only takes into account your initial investment, not how much money you are actually using to make money.
For simplicity, let’s ignore cash flow and principal pay down for a second and say every year your Total Annual Increase is only from appreciation. Let’s say your property appreciates $20K every year. According to Adjusted CoC, your return is $20K divided by $46K or 43.5% every year.
However, this again is misleading because we are only looking at Core Cash Investments, not the actually tied up value that allows us to make that $20K every year. In year one, it cost you $46K to make that $20K (43.5%). However, in year two, it costs you that same $46K plus the $20K you still have tied up in the property (assuming you didn’t refinance). So it cost you $66K to make the next $20K (30.0%). Year three, it will cost you $86K to make the third 20K (23.3%). So, your return in going down and down every year. CoC doesn’t catch this.
This is why I love ROE vs CoC (even Adjusted CoC). ROE accounts for all this.
Let’s end with a visual or two.
This is realistic data — nothing crazy: a 1% growth rate for both rent price and property value, a normal loan amount and payoff schedule, etc etc.
Take a look, what do you notice.
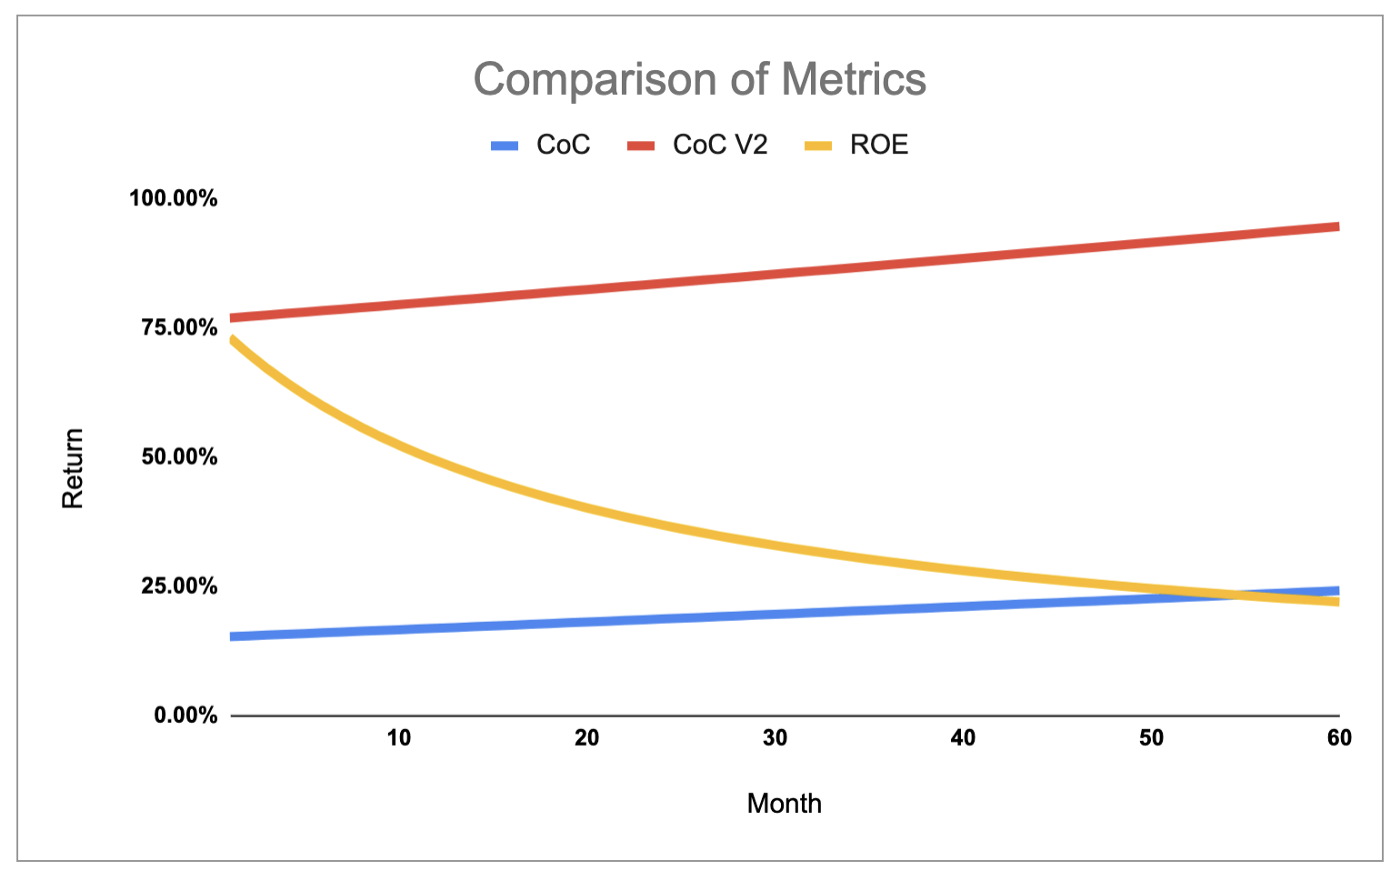
Here’s some things that should jump out.
- CoC is going up every month, things seem to be going well
- Adjusted CoC (CoCV2) is also going up every month, things must be going well
- Wait, the ROE is going down every month, and not even linearly
Here is the same visual for the first 24 months of one of my properties. Rent stayed the same, but we had a very strong year where the property value skyrocketed. Check it out.
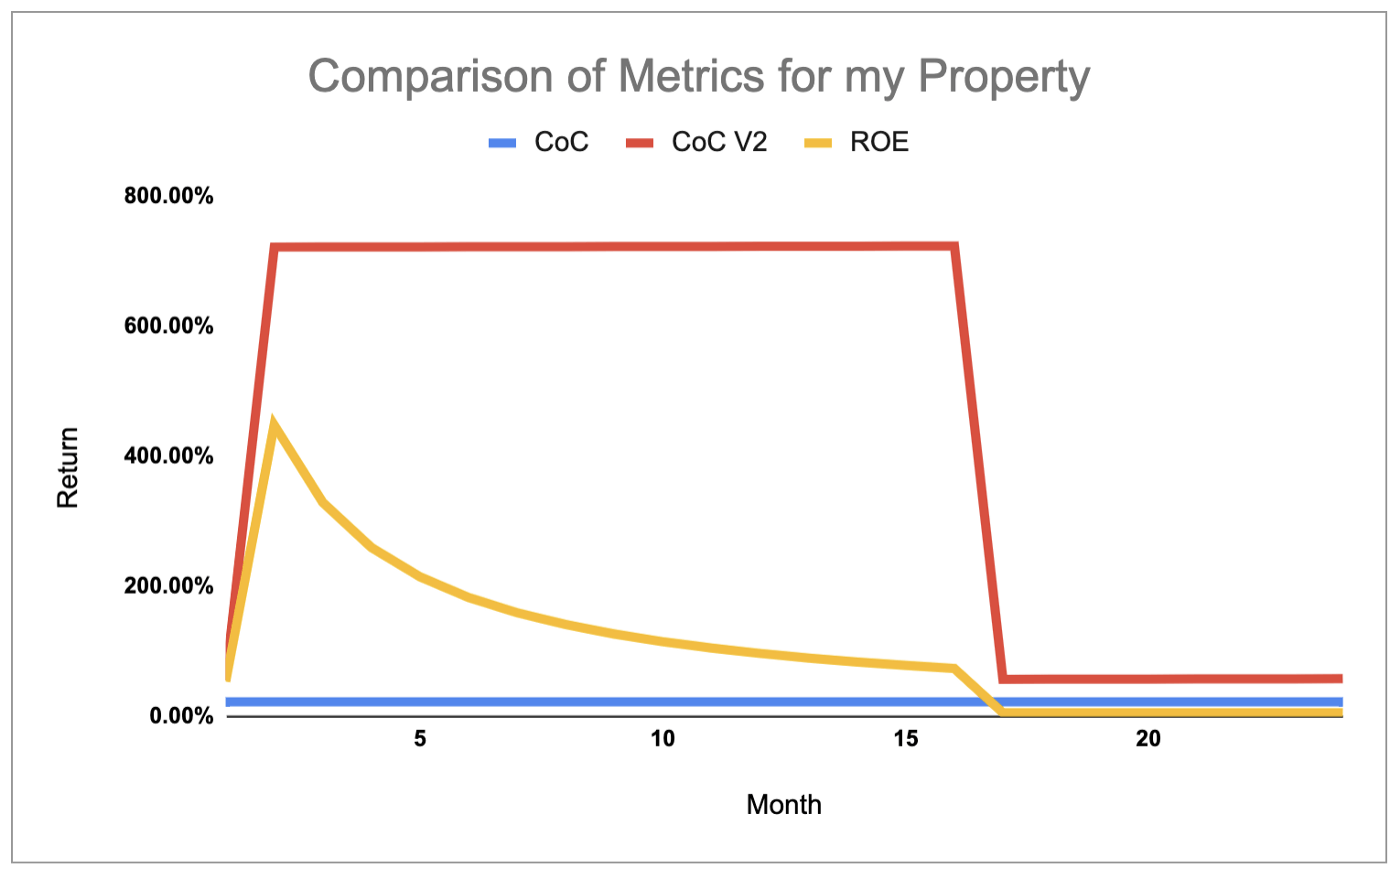
Things you should noticed:
- CoC stays flat the entire time
- Adjusted CoC (CoCV2) catches the big value increase and then reduces, but if you look at the raw data, the line continues to trend upwards after the reduction
- ROE catches the big value increase as well but catches the reductions before Adjusted CoC, and if you look at the raw data, the line continues to trend downwards!
So whereas CoC makes things appear grand and trending upwards, ROE shows how your return is actually decreasing month after month.
Do you see how CoC and even Adjusted CoC could get you in trouble?
Some last thoughts.
If it all seems a bit overwhelming, don’t let it. People think real estate investing or buying your first home is scary. It isn’t. I remember the first time I bought a plane ticket. I was terrified I was doing it wrong. Now it’s easy - you hop online and you’re done. IMHO, buying a home should be just as easy, and tracking how well it is performing should be no different.
The DIY home buying and selling process is getting easier thanks to companies like Homie, Redfin, “iBuyers”, etc…
Managing how well your real estate investments are doing is easier than ever thanks to my favorite app, WayBoz.
WayBoz helps you manage your ROE, CoC and other metrics associated with your properties. You can get notified if any metrics drop below certain thresholds or get tips on how to improve your numbers. You can run numbers for new deals using super user-friendly calculators and even check out how well markets are doing across the United States.
During July 2020 you can get a lifetime free membership on the website.
However, if you like to manage this sort of thing on your own, CoC can be useful, but you have to use it with a grain of salt and in conjunction with the other ROI metrics we mentioned above.
Hope this helps!
Make sure you check back so you catch our upcoming article on how to use all the ROI metrics together to maximize the profitability of your real estate portfolio.

There was screaming. Terrible, deathly screaming. Then there was silence. Someone was dead. It was obvious.

Here's how much you can make with short-term rentals. Real numbers, profitability calculations, and more… all during a wild 2020.

All the best spots from the north to the south, sparing no expense… and how we made more than we spent — all while we were gone.

How and when to leverage powerful real estate metrics like Return on Equity and IRR to confidently make real estate investments.

A clear list of ROI metrics to consider in real estate investing, and how to calculate them... in normal-people speak.

How COVID-19 is impacting my short and long term rentals differently and how it’s impacting our property investment strategies.

The two most common AirBnb questions I get: How much do you make? How is COVID impacting business? Well, here you go — pure factual numbers.

Return on Equity — perhaps the most important real estate metric you should be considering.