We use just 2 metrics to buy real estate - and it’s continually easy and profitable for us (Part 1)
How and when to leverage powerful real estate metrics like Return on Equity and IRR to confidently make real estate investments

- You’re not wasting money on your property investments (future or current)
- You’re not missing out on, or unnecessarily fearful of, potential investment opportunities
- What metrics to consider Before you Buy
- What metrics to consider When you Own
- What metrics to consider After You’ve Sold
- Return on Equity (predicted)
- IRR (predicted)
- Return on Equity: This is how well the cash value of your ownership in an investment - AKA your equity - is performing at a point in time (EG, at month 7, my $50,000 in equity gives me an 8% annualized return)
- IRR: This is how well your overall investment performed annually assuming it stopped at a certain period (EG, I sold on month 72, so my overall return on the investment each year was 13%)
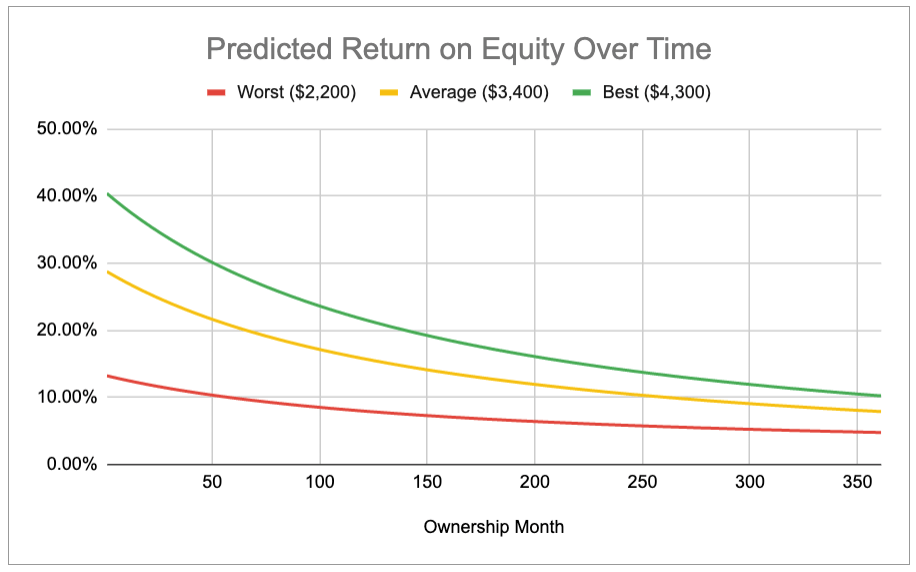
As you can see, even in the Worst case scenario, the predicted RoE still starts around 13% annually and will take a few years before it drops under 10%. Meaning my $92,000 down payment is going to generate me somewhere between $9,000 to $12,000 a year in value after all expenses are paid.
In the Best case scenario, things are obviously great with a starting annual RoE around 40%. That’s $36,800 in annual value generated! I don’t know where else I can possibly get a 40% return without having to stomach a huge degree of risk.
So, in summary, what we see here is that the money or equity that is going into this investment is predicted to generate a great return each year (10% to 40%) - way better than stashing it in a bank account that only gives me a .5% return annually (which would only be a miserable $460 in annual value gained).
Quick reminder, ROE usually decreases each month. This is because as the mortgage gets paid, my equity is increasing but my income is staying flat. So basically, I have more and more money invested in the property, but my income is staying the same, which decreases my overall return on that equity (basically my denominator keeps getting bigger while my numerator stays the same).
Now let’s look at IRR
Remember, IRR will help us see what our overall return might be.
Below, we see what our overall annual return is predicted to be if we happened to have sold at any of the specific months shown on the X-axis (I only show the first 40 months because it remains fairly consistent).
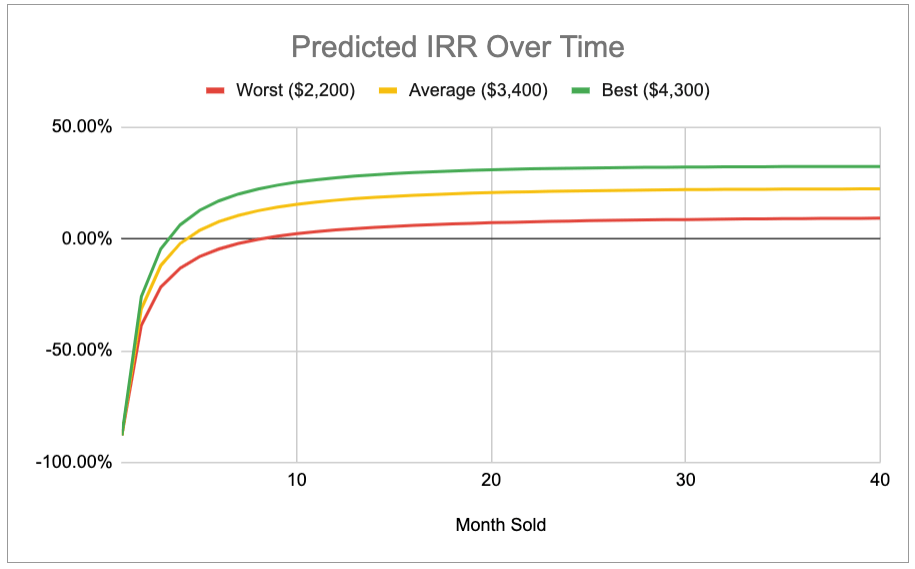
What I see here is that as long as I keep the property for at least 10 months, my overall return will be positive (though extremely small - barely 1% for Worst case). So it’s at least safe. Great, I plan on keeping it for a number of years.
However, since I am planning on keeping it longer, I need to see what is happening over time.
In the Worst income case scenario, my IRR seems to cap out around 9% after three years. In other words, if I sell at year 3 or 4 or 7 or 9, as long as things stay consistent, I basically will keep averaging around a 9% return each year.
9%? Hmm. I possibly could beat that return in the stock market. Should my money go there instead? Maybe, that’s up to the investor.
My real estate track record is much better than my stock market track record, so I am keeping my money here, even if just for a 9% return. IMHO, real estate is also a lot less risky than stocks if done right, and can still generate enormous returns, as demonstrated above.
For me, the IRR looks good on this investment. I’m targeting
Average or
Best case income levels, which have an IRR that caps out and steadies around 23% and 33% respectively. Plus, as mentioned, 9% in the
Worst case isn’t that bad.
RoE vs IRR
Just to provide a bit of clarity on the difference between the RoE and IRR metrics… RoE is looking at your equity at a moment in time - it doesn’t care about the past or future. It is telling you how your equity is doing right now. IRR is taking the entire investment - beginning, middle, and end - into consideration.
Some might argue you just need IRR. I personally like to pair it with RoE because I get a snapshot and overall picture at the same time. However, if you had to pick one, you could get away with just IRR.
So, prior to buying, considering these two core metrics can give you a high degree of confidence in your purchase. In my example, I see that the Return on my Equity is not only positive each month, but it is very positive (anywhere from 13% to 40%), providing a return better than the stock market and other investment options. I see that if I keep my investment for at least a certain period, my overall return, or IRR, is very strong (anywhere from 9% to 33%).
But what about those variables we didn’t change?
Another great thing about these metrics is it can help if you want to factor in even more worse case scenarios. Like, what if there is a big market slump and property values decrease?
It just happens that where I am buying my next property, it is predicted that the property values will decrease by 1% during the next year.
Should I be worried? Let’s see.
I’ll use the Predicted Return on Equity with the Average income scenario. However, now I’ll take that scenario and show the impact of market growth rates: one where property values increase annually by 1% (it’s actually been doing much better than this), one where they stay flat, and one where they decrease annually by 1% (as predicted).
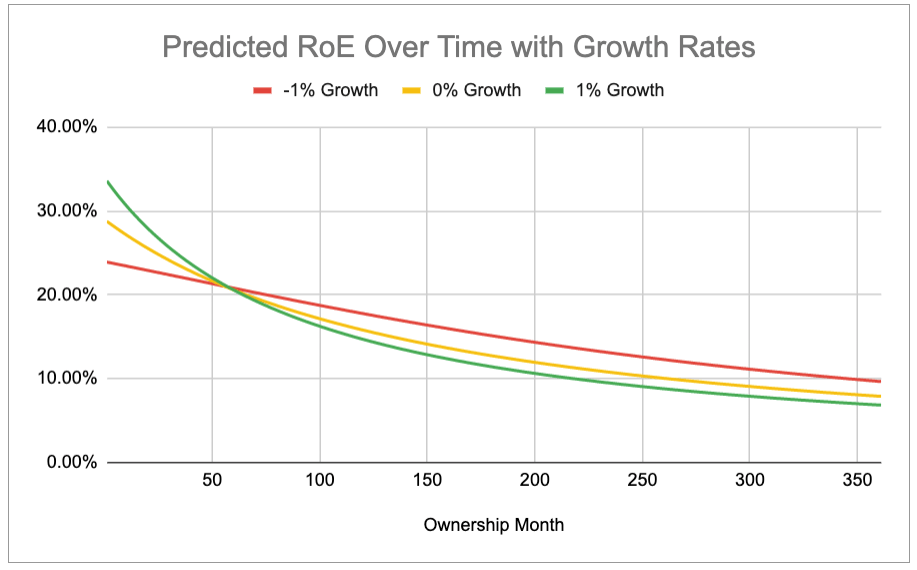
Even with the -1% Growth, my RoE is still quite strong and actually staying stronger than the other rates. This is mostly because my equity isn’t growing as fast as the other two scenarios (IE, the denominator isn’t getting bigger as quickly).
However, this could be dangerously misleading. We need to look at IRR to get a more accurate impact of the -1% growth rate.

The -1% growth rate puts us just slightly under our original estimate. Originally we capped out the Average income IRR at 23%. Now it caps out at 20%. Still a great annual return!
You can buy with confidence
Prior to buying, considering these core metrics can give you a high degree of confidence in your purchase. In my example, I see that the Return on my Equity is not only positive each month, but it is very positive (anywhere from 13% to 40%), providing a return better than the stock market and other investment options. I see that if I keep my investment for at least a certain period, my overall return, or IRR, is very strong (anywhere from 9% to 33%). If I apply a NEGATIVE growth rate, I will have a strong IRR of 20% (for the Average income scenario).
I feel quite good about this investment.
As mentioned, if you wanted, you could make the above chart even more exact by slightly discounting your income to account for even more bad scenarios, like vacancy. One thing I like to do - which I won’t cover here - is go into “Ultra Worst Case” scenarios. Basically, what happens if all my properties go vacant? How long can I afford that with just savings? If I have a day job, can I cover this extreme scenario?
What if you already own a property… now what?
Next up is how to manage your investment after you already own it. So many people sell their properties just because they have a ton of equity.
That might be costing you thousands each year!
Stay tuned for Part II coming soon.
Also, if you haven't already, don’t forget to sign up for WayBoz!
Follow us on social media to stay up to speed on all we're doing. Two quick places where you should follow us are:
LinkedIn: https://www.linkedin.com/company/wayboz/
Our Blog: https://medium.com/@wayboz